
Classroom Learning Trends 2025/2026
Listening to 3,042 classes, week by week, and what it tells us about how classrooms change before outcomes do. Insight from more than 545,000 student check-ins at 1,341 schools.
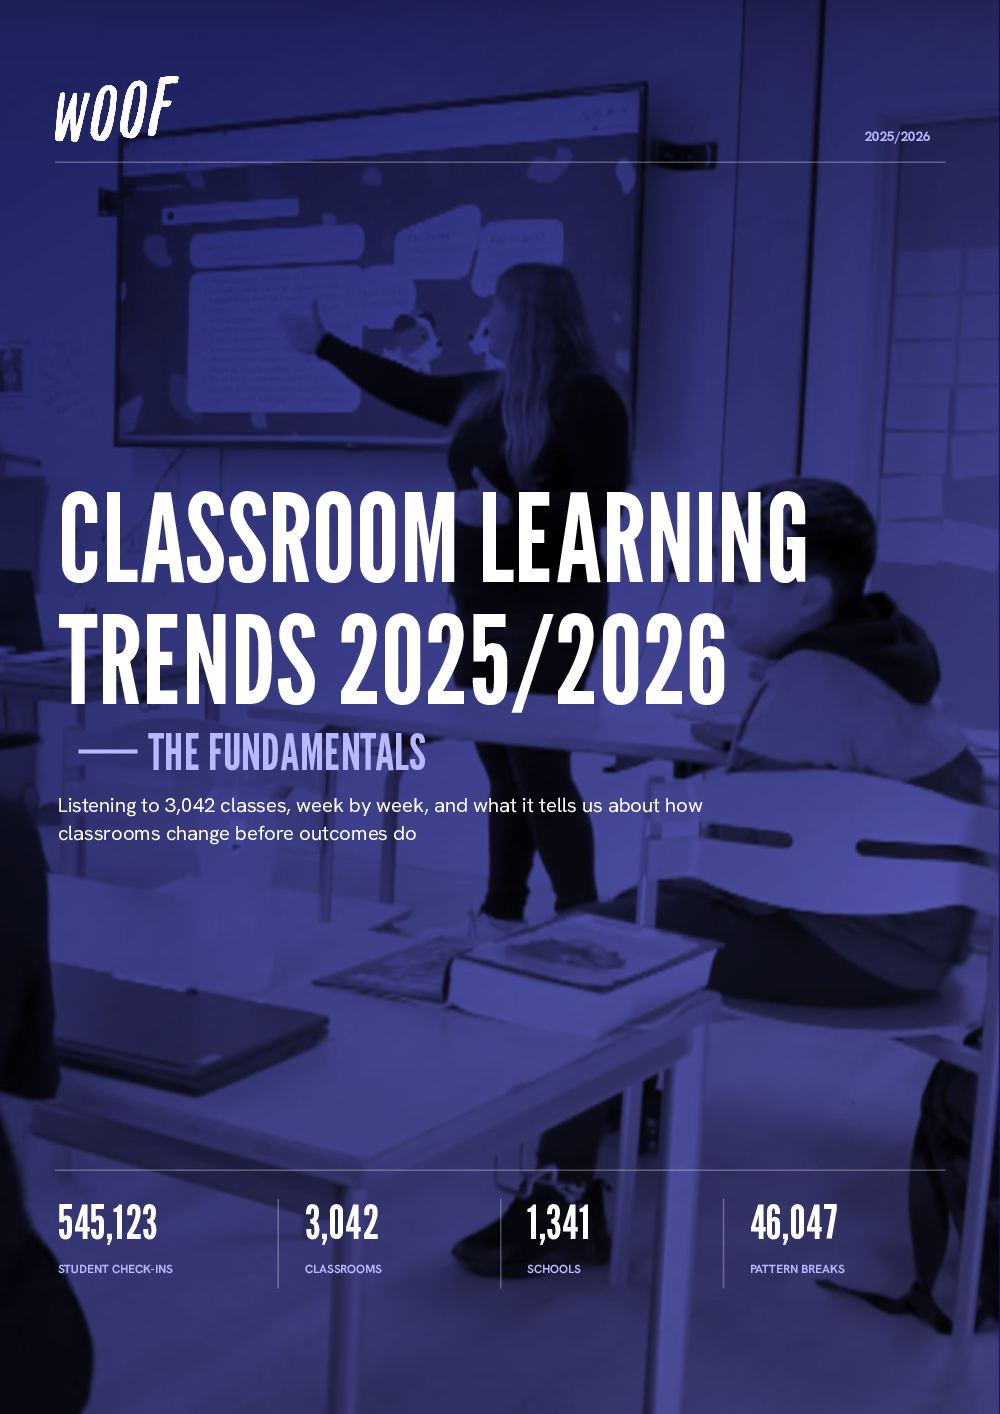
Read the full report online
Read WOOF's Classroom Learning Trends online, or to download it as a PDF.
Click or swipe the page corners to turn the pages.
When listening to classrooms continuously, it is clear: we need to revisit the fundamentals
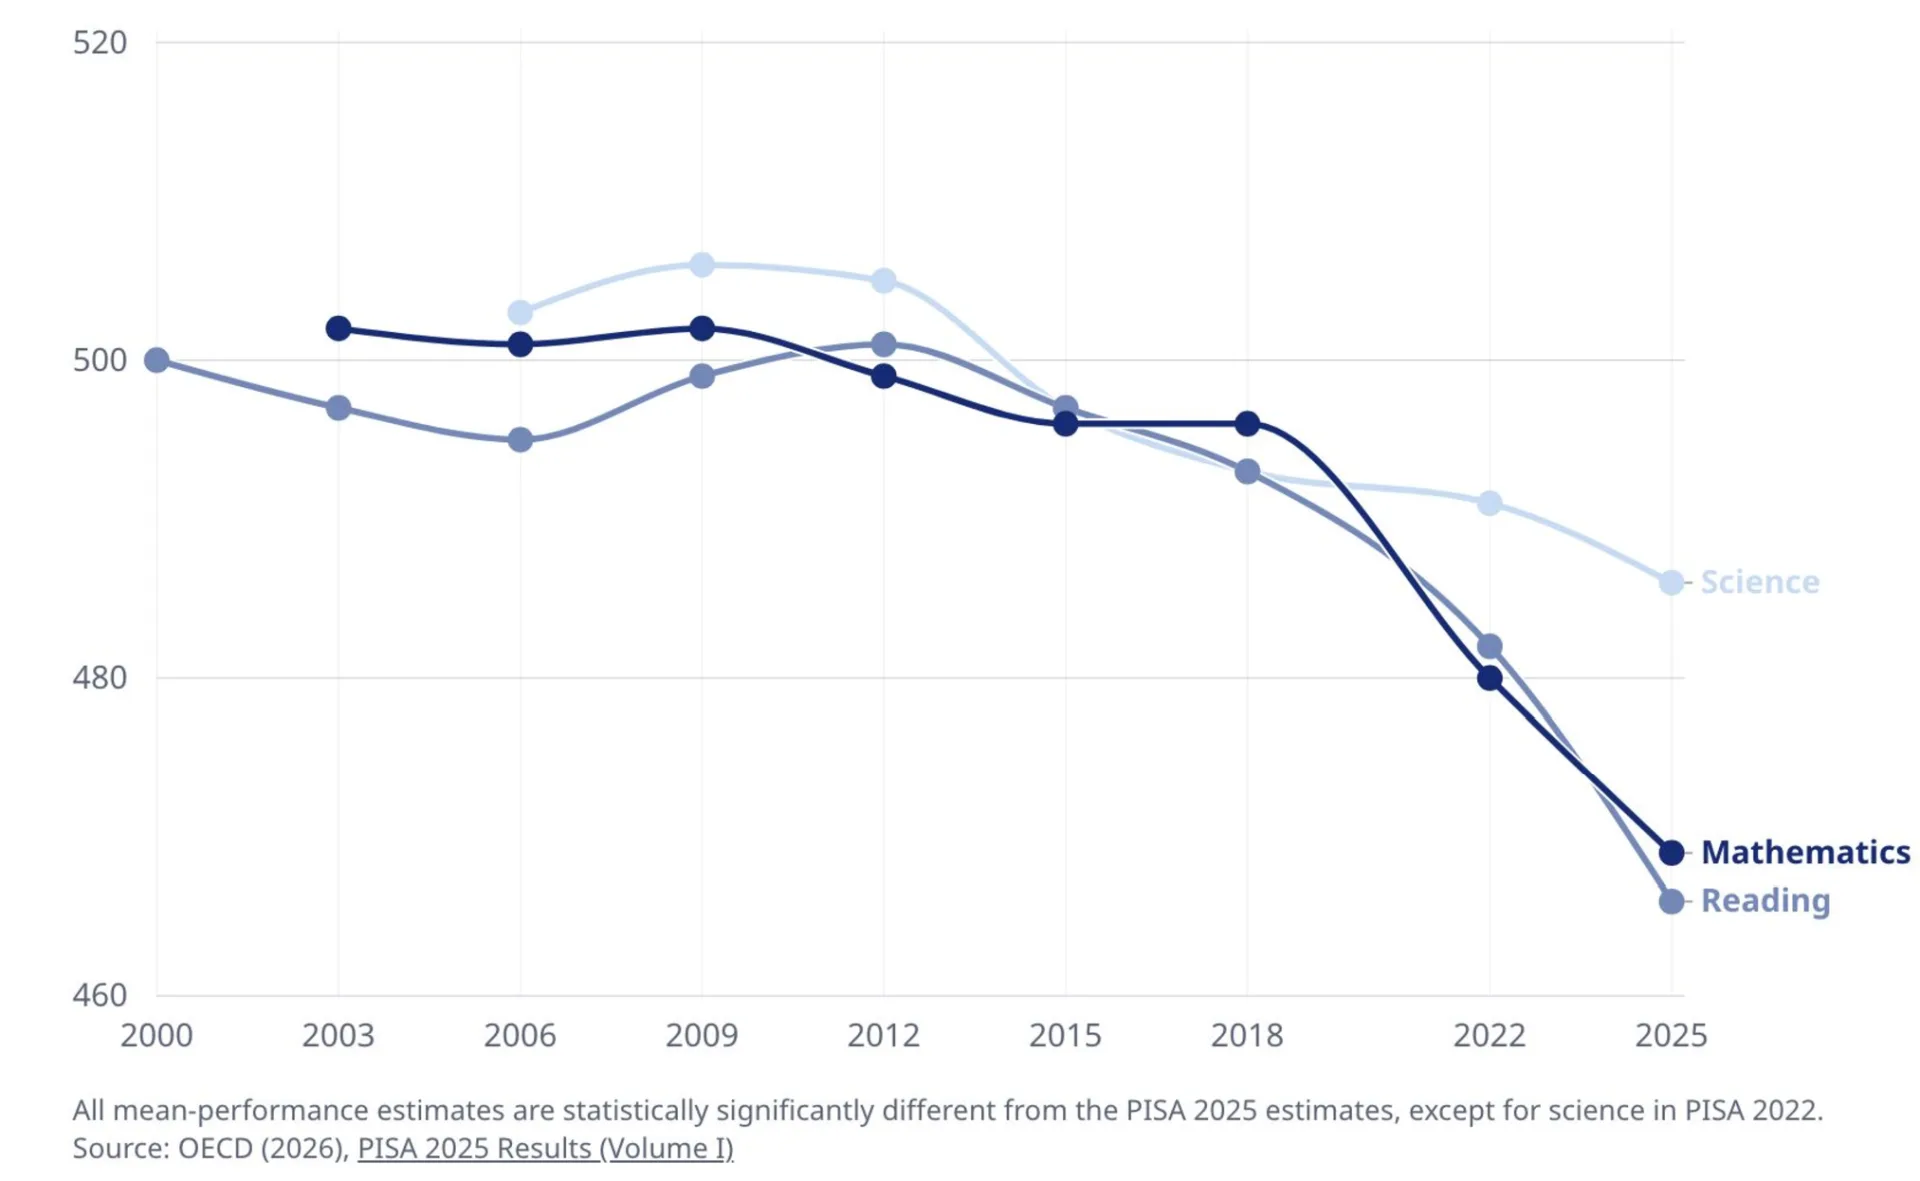
In 2025, OECD PISA results showed student performance continuing to decline across many education systems. In reading, the OECD average reached its lowest level ever recorded, 28 points below the 2015 result. Behind those numbers are millions of students moving through classrooms where it seems something categorical has changed, yet we know surprisingly little about what drives these learning communities and their learning.
Most schools can tell you attendance and grades, and where they struggle to perform. Far fewer can see the classroom conditions changing underneath those numbers. Continuous classroom data makes it possible to see those changes earlier, while there is still time to understand them and act.
The foundation of the trends
Not built on a single annual survey, but on real signals from real classroom interactions. During the 2025/26 school year, students completed 328,432 anonymous micro check-ins and evidence-based activities across Northern Europe, Australia and 34 U.S. states.
Dive into the trends
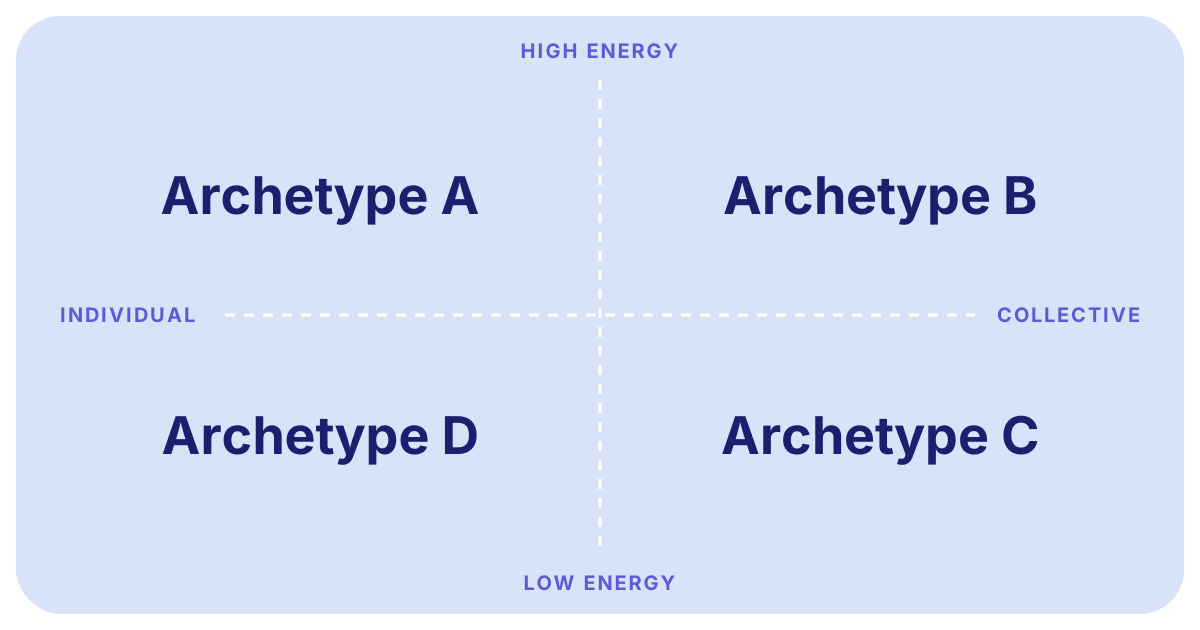
Classroom archetypes are becoming drivers for teaching outcomes
Every classroom is different, and treating them as if they are the same should be a thing of the past. Understanding a class's archetype helps teachers and leaders respond to what that classroom needs.
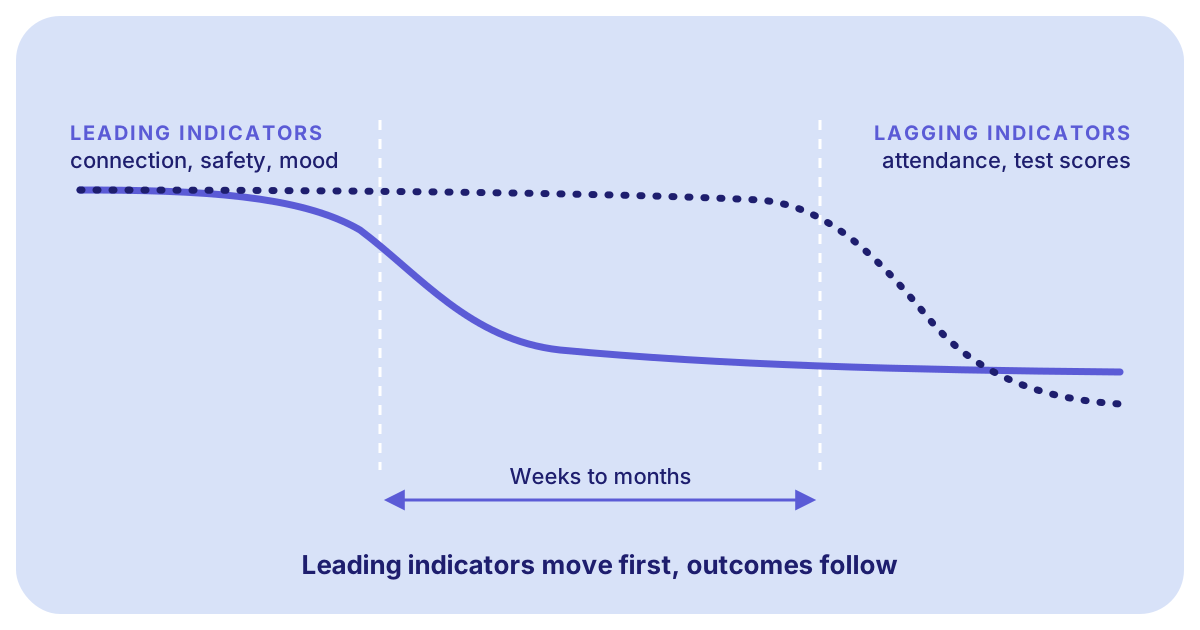
Educational focus is shifting from end-year results to real-time insights
Leading indicators like connection, safety, engagement, energy and mood show what is happening before attendance, behavior or academic results move.
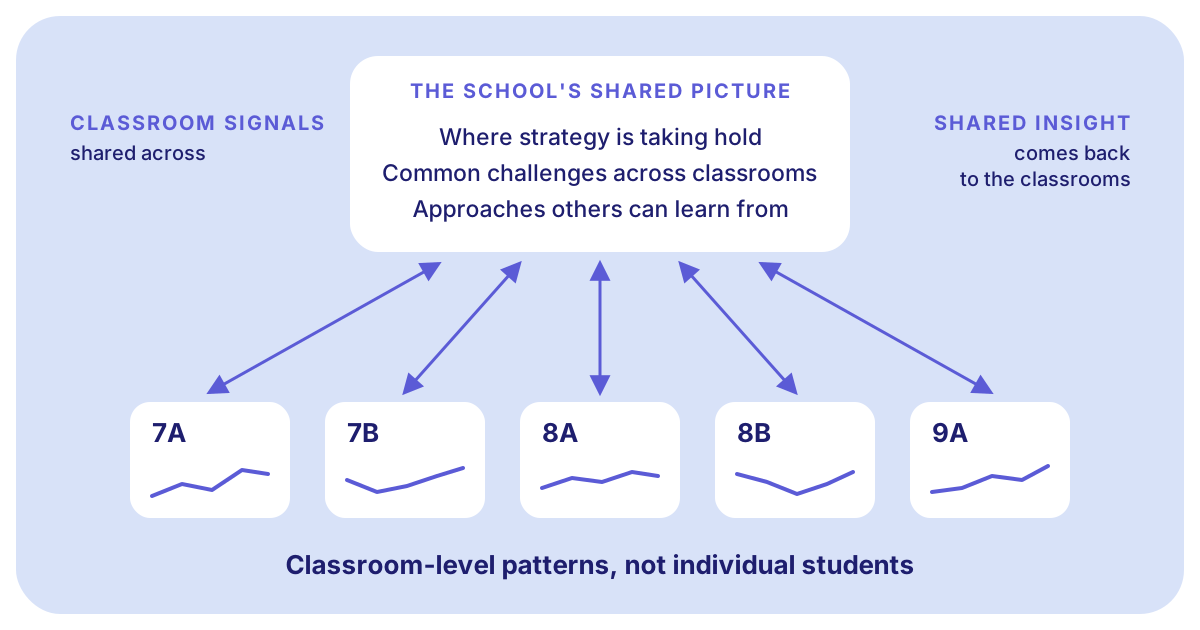
Real-time data is transforming educational leadership
When data from classrooms is connected across a school, leaders can see where strategy is taking hold, where it is not, and where classrooms need support.
The field wants validated impact, not just good intentions
Schools, foundations and municipalities increasingly want to see real outcomes. A Pattern Break can turn the marathon into a sprint and give them proactive data to follow.
When a classroom works with WOOF
In one 7th-grade class, "Sleep" kept showing up as a low factor in the check-ins. The teacher didn't just note it and move on. She asked the class: "It looks like sleep is one of our lows again. How about we do a course on sleep?"
The class landed on three strategies: "Having a cup of tea before bedtime", "Reading before going to bed" and "Putting away phones before bedtime". The teacher also reached out to parents to share the strategies the class had agreed on, helping build parental support and engagement.
Over the following weeks, fewer students chose "Sleep" as a negative impact on their mood, the overall mood level rose and the class created a Pattern Break: a positive development in data, not just one day, but a trend over several check-ins.
It's not "how are you doing?", it's "how are we doing?"
When real-time classroom data informs all layers of school districts
During the 2024/25 school year, WOOF was introduced in a small number of schools within a larger school district. The results were promising, and for 2025/26 WOOF was rolled out as the district's shared infrastructure for understanding and improving classroom conditions.
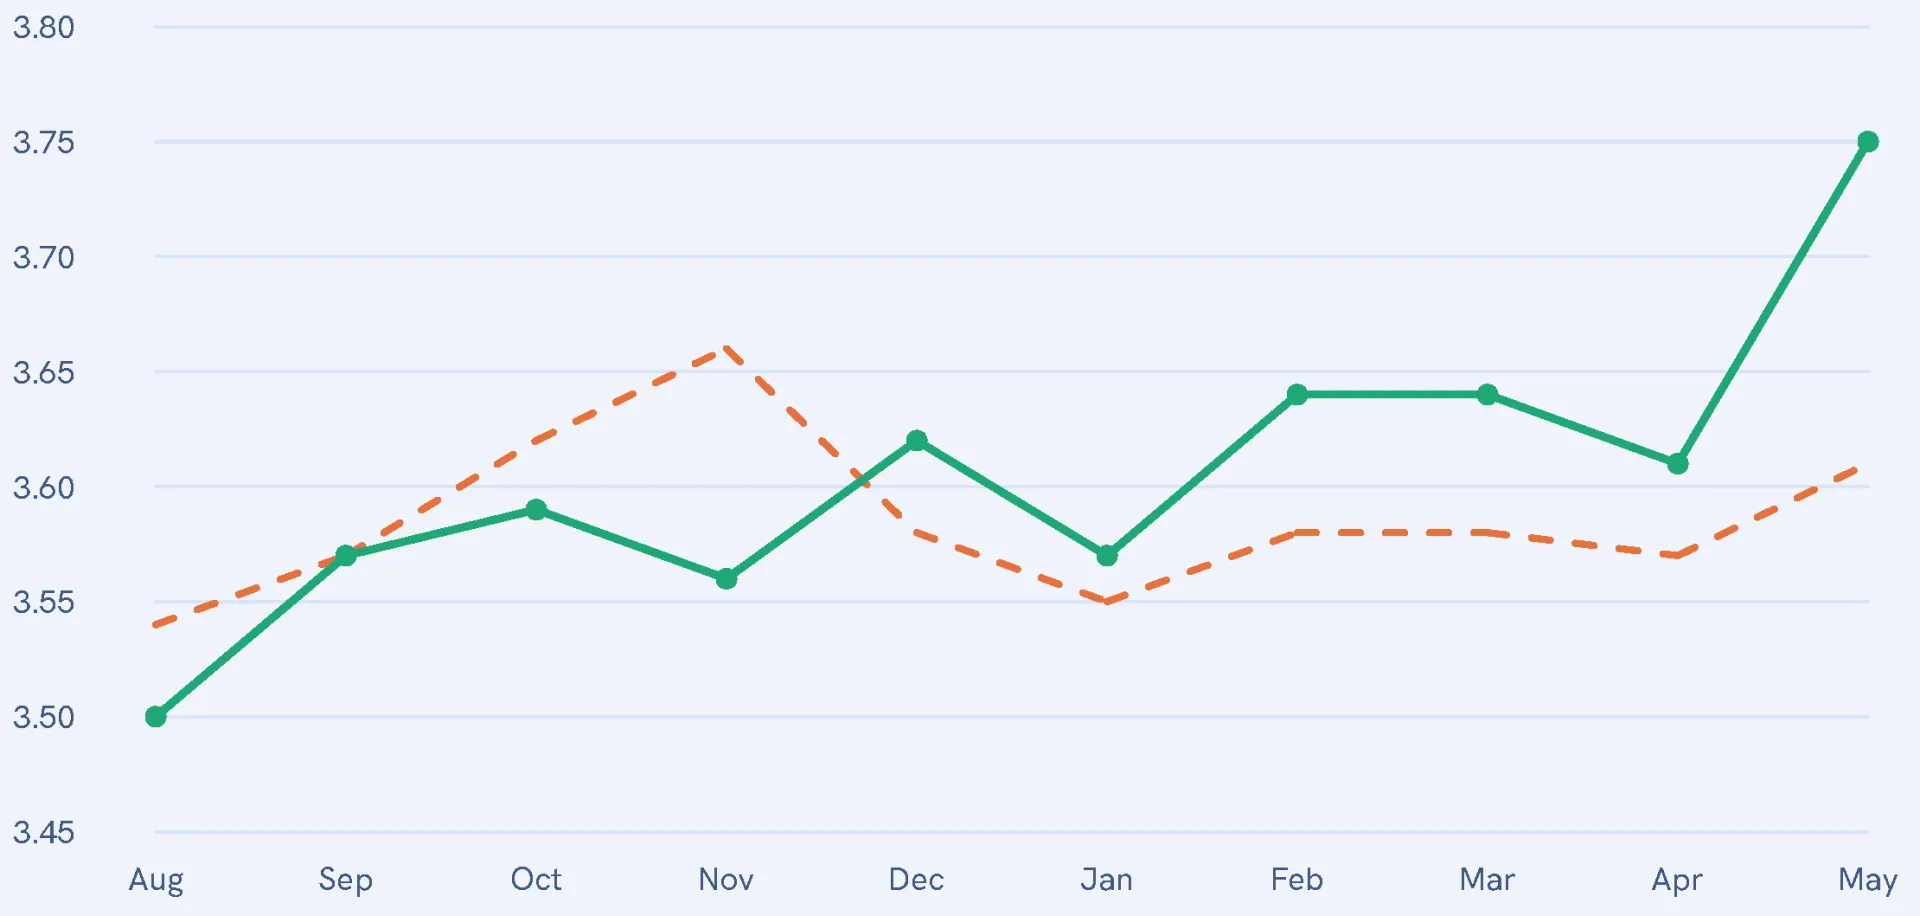
Across the district, schools systematically improved their classroom indicators. Student mood rose. Red flags (students reporting low mood) fell. The share of students reporting low mood during check-ins fell by 21%, equivalent to an average of 109 students shifting from low to medium or high mood.
These are not simply numbers, but real lives: 109 fewer children who said that they were feeling bad. Improving classroom conditions is not only about measuring what is happening. It is about building the intelligence required to change what happens next.
When Pattern Breaks turn marathons into sprints and give us proactive data
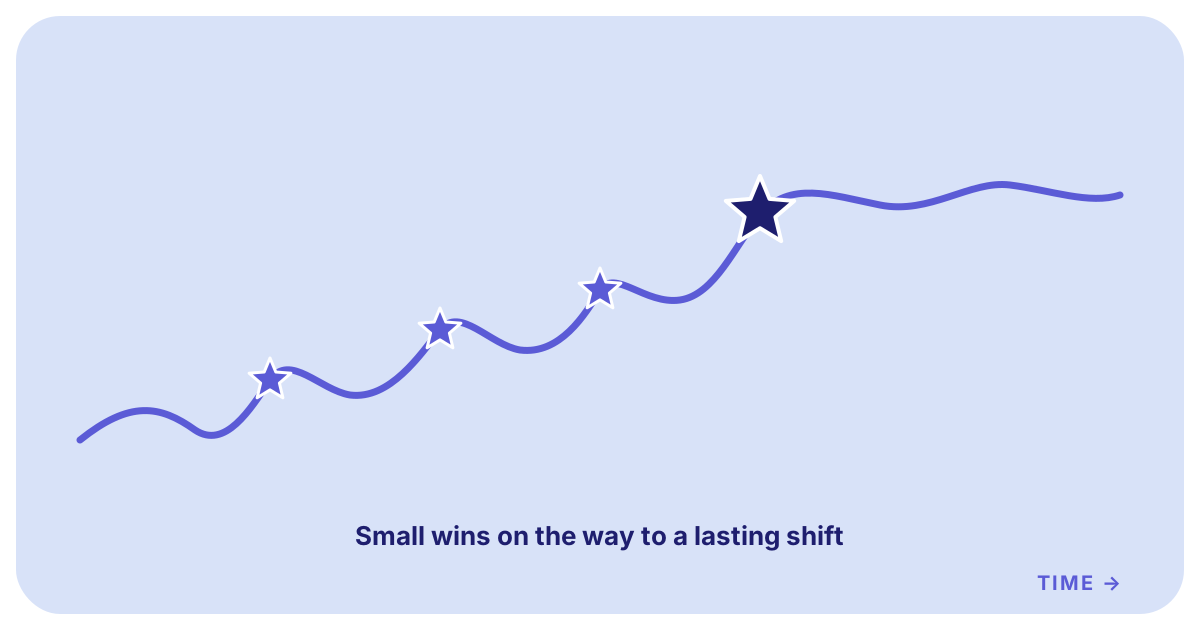
When a dominant undesirable classroom culture has taken root, it is a marathon to change. Looking across thousands of classrooms over time, we found an early signal of positive development to turn the marathon into sprints. We call it a Pattern Break: a measurable moment where a classroom moves out of a negative wellbeing pattern and into a more positive one.
A Pattern Break doesn't wait for a term to end or a report to be written. It shows up within weeks, while a teacher can still ask the class: how does this change feel, and what did we do that brought it about? In 2025/26, we recorded 30,918 of them.
Looking across classes over a full year, we see a statistically significant correlation between a class experiencing a Pattern Break and stronger mood outcomes over the longer term. That doesn't prove one causes the other, but it's a strong signal that a Pattern Break isn't only a momentary shift. It may be an early marker of a class moving onto a better trajectory.
A Pattern Break is the moment a class leaves a low wellbeing pattern behind and settles into a better one. The class's weekly mood hovers around a threshold (0.2 points above its lowest running average) and dips, then rises above the threshold for two check-ins in a row, and stays there. For the teacher, this is an early sign that something is working, visible within weeks instead of at the end of the year.
What do these trends tell us about the future of education?
Today, much of what schools learn remains local. One teacher discovers something that works and shares it with the colleagues they happen to work alongside. One school develops an effective approach, and it stays within that school. One district learns something from an initiative, but that learning may never reach the district next door.
The knowledge exists. It simply does not compound systematically.
Continuous classroom data creates the possibility of something different. As more classrooms become visible over time, we can begin to understand not only what changes, but what tends to work, for which kinds of classrooms, under which conditions.
Today, most of what a classroom learns stays in that classroom. This loop shows how it can travel instead: every turn of the loop gives the next class a better-informed starting point.
The foundation of the trends
The dataset
A unique set of data
Privacy and anonymity
Quantitative + qualitative insight
Research collaborations
The foundation of the trends
See how a classroom check-in works
A check-in takes only a few minutes and creates an anonymous shared picture of how the class is doing.
Want to discuss what this could mean for your schools or district?
Book a focused 30-minute conversation with one of WOOF's founders. We will cover the key findings, what they may mean in your context, and the questions they raise for school leaders. No product presentation or demo: the briefing is a discussion of the research and its implications.
Join the conversation
Follow our findings as they develop. We will keep sharing insights, cases and new questions from classroom data throughout the year.
Follow WOOF on LinkedInNews from WOOF
Receive new WOOF insights, reports and invitations to upcoming briefings and webinars.